Guide to Gage R&R (Repeatability & Reproducibility) | Measurement Systems Analysis
01. What is Gage R&R (Measurement System Analysis)?
In manufacturing, our goal is to produce parts that perfectly match their design specifications. However, real-world manufacturing processes inevitably introduce variations from these target values.
When we measure these variations, we face a critical question: Are we measuring actual differences between parts, or are we seeing measurement system inconsistencies?
This is where we use a Gage R&R (Repeatability and Reproducibility) study, a statistical tool that helps us decompose measurement variation into its key components:
- Part Variation: The true differences in dimensions between manufactured parts
- Measurement System Variation: The combined variation from:
- The measuring instrument (gage)
- The operator performing the measurement
- The measurement process itself
Gage R&R (Repeatability & Reproducibility) studies are broadly classified into two types based on the measurement method and type of data collected: Attribute and Variable.
02. Why is Gage R&R Important?
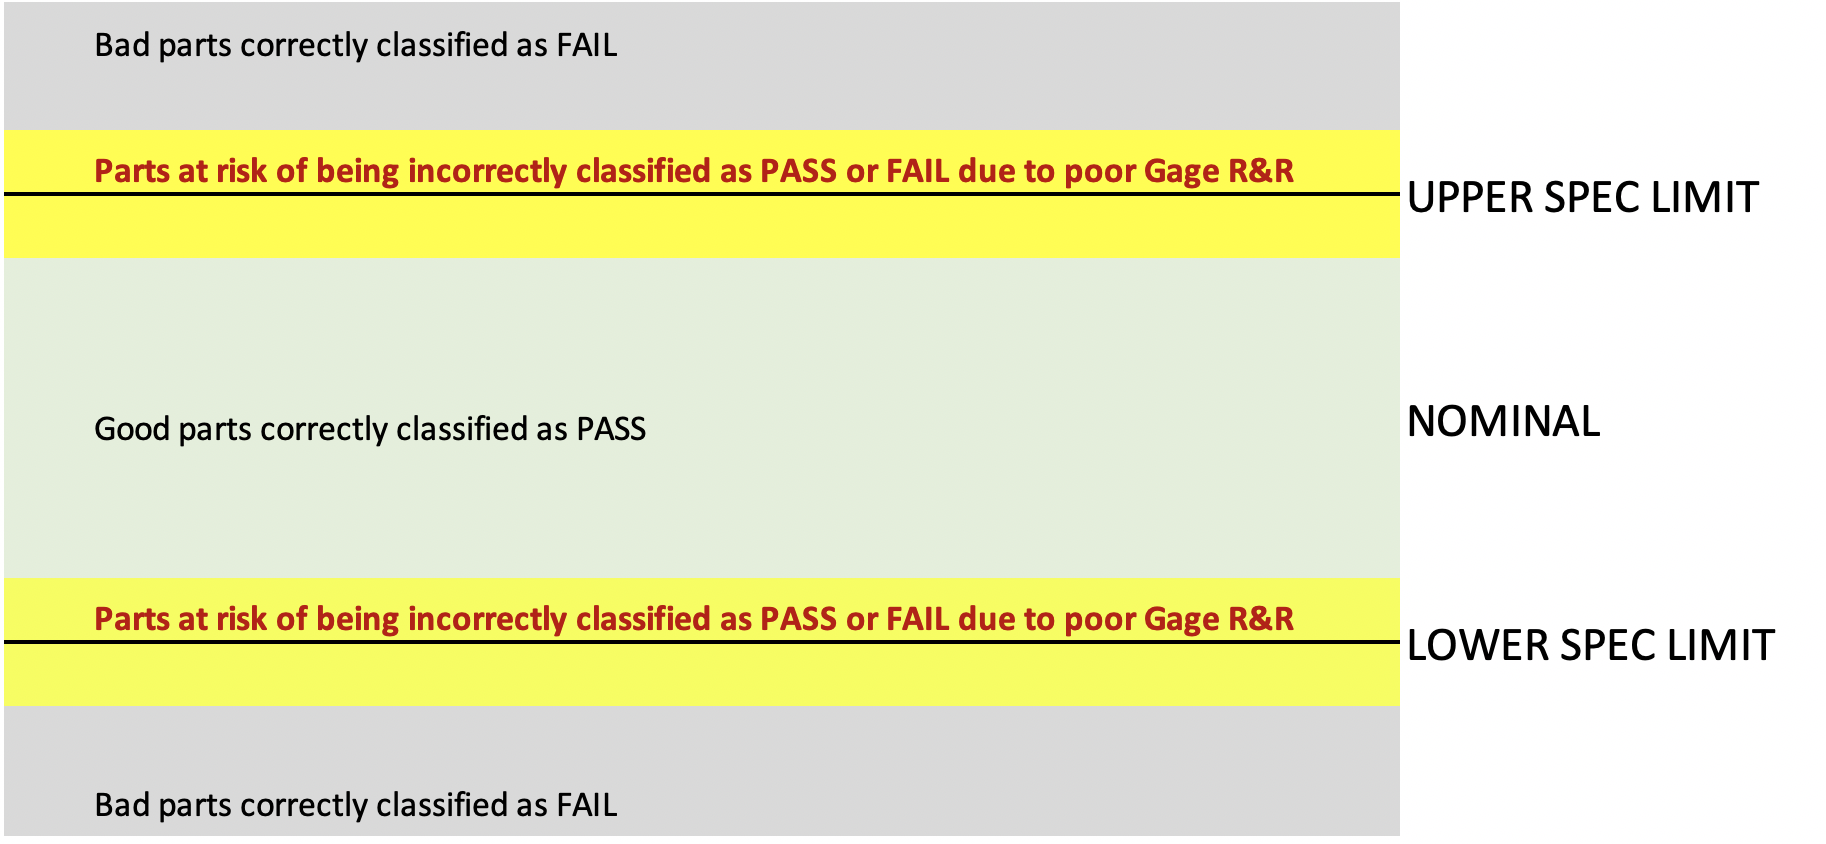
A reliable measurement system should primarily reflect actual part-to-part differences, with minimal variation introduced by the operator, gage or measurement process itself. When a measurement system has poor R&R:
- Parts near specification limits (USL/LSL) may be incorrectly classified
- Good parts might be rejected (Type I error)
- Defective parts might be accepted (Type II error)
IMPLICATIONS: With poor Gage R&R, parts that fall in the yellow zone in the run-chart on the right are at risk of being misclassified as Pass or Fail.
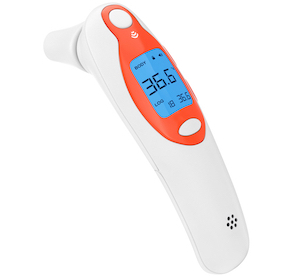
03. An Analogy: Measuring your child's temperature
As an example, you may choose to use an ear thermometer (the gage) to measure your child's body temperature (the parameter being measured). The measurement method involves inserting the tip of the ear thermometer into the ear canal, and then pressing a button to record the temperature.
When you use the thermometer, you assume that:
- This method will detect any significant increase in the child's body temperature.
- The measurements will be nearly identical if you repeat the measurement (within a short interval of time), i.e. measurements are Repeatable across multiple trials.
- The results will be nearly identical if you and your spouse were to independently make this measurement, i.e. measurements are Reproducible across operators.
In the ideal case, if you and your spouse were to make measurements a few hours apart, the only reason for a change in reading should be an actual change in body temperature. How you position the thermometer or any inherent variability in the thermometer should have little to no impact on the measurement.
And this is why we run a Gage R&R study - to determine whether the difference in readings comes from the thermometer itself, the operator (person making the measurement), or from the patient's temperature (ideally all the variation comes from the patient's actual temperature).
04. Sources of Variation in a Measurement System
There are five main sources of variation in a Measurement System.
- Bias: Bias represents a systematic error in measurements. It's the difference between the observed average and the true reference value, and appears as a consistent shift from the true value. It can occur due to gage wear or improper calibration
- Linearity: Linearity describes how bias changes across the measurement range. It measures if the bias remains constant across the operating range of the gage, and is critical for ensuring consistent measurements across different sizes
- Stability: Stability refers to the consistency of measurements over time. It requires monitoring of environmental conditions: Temperature and Humidity
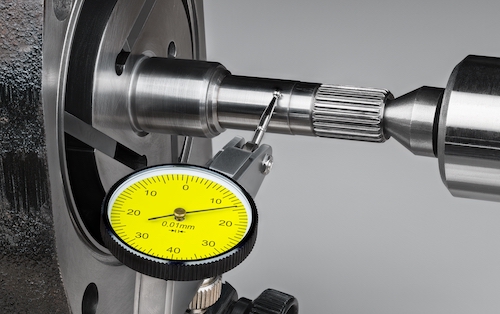
- Repeatability (Equipment Variation): Repeatability is a measure of the differences between measurements when the same operator measures the same part multiple times.
- Reproducibility (Operator or Appraiser Variation): Reproducibility is a measure of the differences between measurements when different operators measure the same parts.
Bias, Linearity and Stability are addressed during calibration. Repeatability and Reproducibility are measured through a Gage R&R study.
05. Attribute Gage R&R Study
Overview
It the measurement system outputs a pass or fail value, or if it classifies the output into two or more categories (e.g. Class A, B, C), then we use an Attribute Gage R&R study. Common measurement systems with attribuite data output include: Go/No-Go gages, Thread gages, Visual inspections, Color matching, Surface finish comparisons etc.
Study Structure
- Parts: 30
- Operators: 3 (A, B, C)
- Trials: 3 (each operator repeats each measurement 3 times)
- Total Measurements: 30 x 3 x 3 = 270
Selecting the Parts
- Parts should represent the full range of production variation
- Should include parts that are clearly acceptable and clearly unacceptable
- Include borderline parts (near specification limits)
Selecting the Operators
- Operators should be those who normally perform the measurement
- Operators should be trained in the measurement method
- Operators should represent different shifts if applicable
Collecting the Data
- Each operator measures each part multiple times (3 Trials)
- For each trial, the parts should be presented to the operator in a random order, but data for Part 1 should always be recorded as Part 1 (and so on).
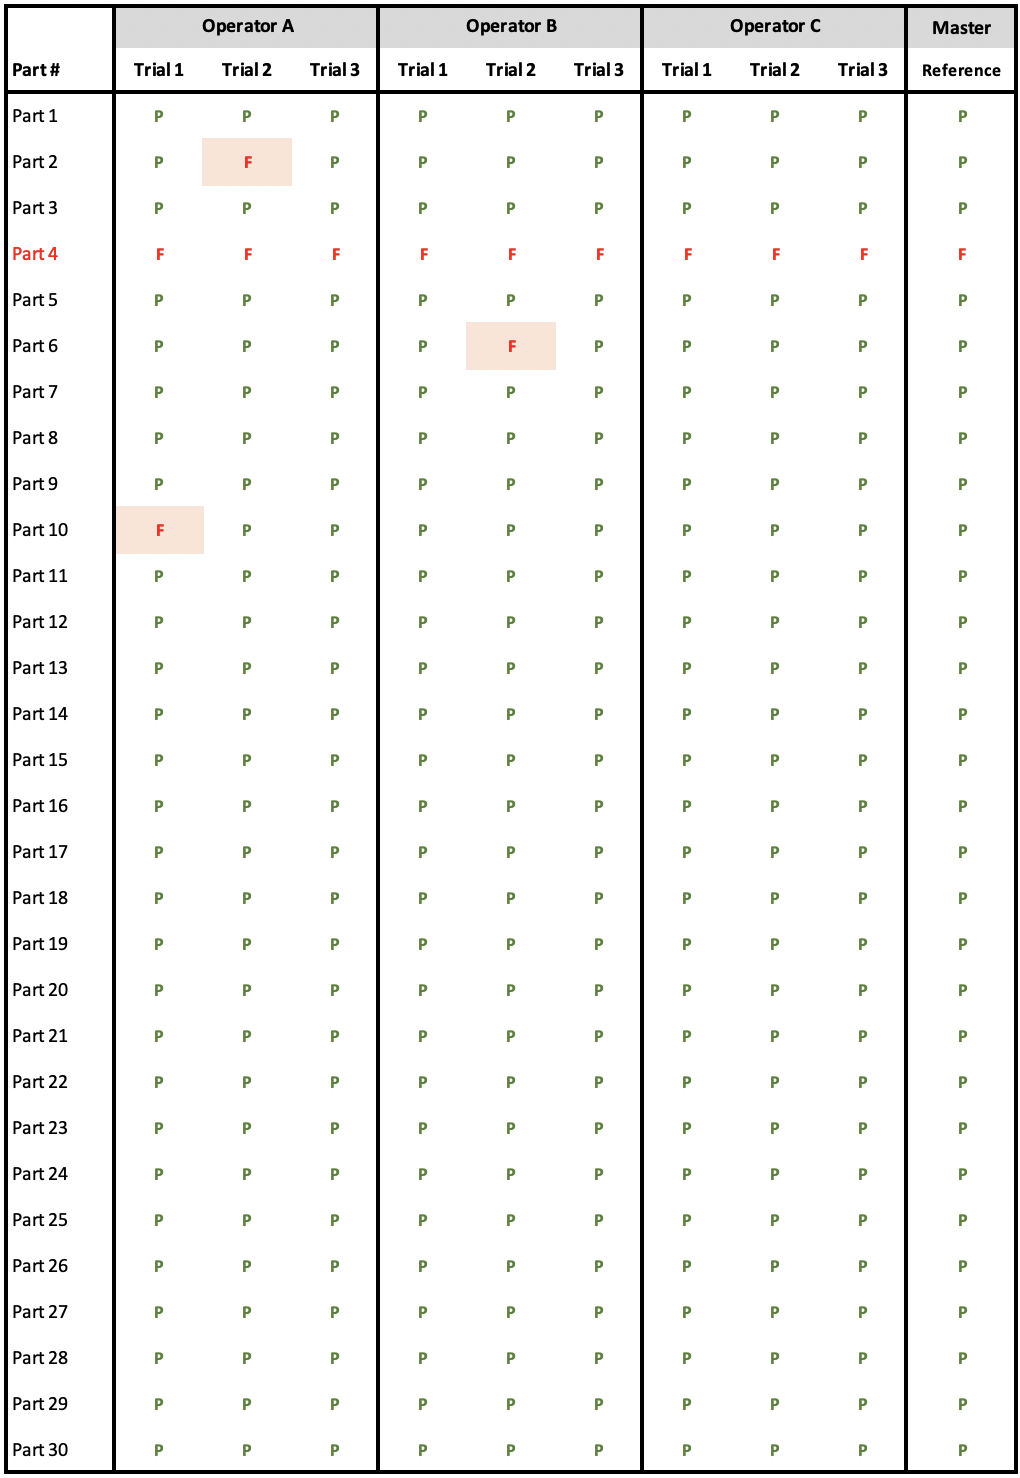
Data Table
- P = Pass, F = Fail
- Master (Reference) column shows how that part was calssified by an expert or against a standard.
- Highlighted cells with a pink background indicate measurements that deviate from the reference value
06: Repeatability in Attribute Gage R&R
Overview:
In an Attribute Gage R&R study, Repeatability measures how consistent each operator is with themselves when measuring the same part multiple times. i.e. it shows whether an operator can get the same answer (Pass/Fail) when measuring the same part repeatedly
For example, in our data:
- Operator A was inconsistent with Parts 2 and 10 (got different results when measuring the same part)
- Operator B was inconsistent with Part 6
- Operator C was perfectly consistent (always got same result when measuring same part)
A low repeatability score suggests that the measurement method or acceptance criteria might be unclear, or the operator might need more training, or the system might be too difficult to use consistently
High repeatability (like our 97.78%) indicates operators can consistently make the same decision when measuring the same part multiple times, which is what we want in a good measurement system.
Calculation
To calculate Repeatability (Within-Appraiser Agreement), we measure how many times each operator arrives at the same assessment within each trial (i.e. are each operator's measurements for the same part consistent?).
When measuring a single part, there are 3 comparisons being made between trials for each operator. Let's use Part 2 for Operator A as an example (PPF). The three comparisons and their outcomes are:
- Trial 1 (P) vs Trial 2 (F): Disagree
- Trial 1 (P) vs Trial 3 (P): Agree
- Trial 2 (F) vs Trial 3 (P): Disagree
Part Score: Only 1 out of 3 comparisons shows agreement, which gives us 1/3 = 33.3%
Operator's Agreement % = (Sum of all part scores / Total number of parts) x 100
Operator A Repeatability
- Part Scores for Agreement: 28 parts x 1.0 = 28.0
- Part Scores for Disagreement: 2 parts x 0.333 = 0.666
- Total Part Score: 28.0 + 0.666 = 28.666
- Agreement Percentage: (28.666 / 30) x 100 = 95.55%
Operator B Repeatability
- Part Scores for Agreement: 29 parts x 1.0 = 29.0
- Part Scores for Disagreement: 1 part x 0.333 = 0.333
- Total Part Score: 29.0 + 0.333 = 29.333
- Agreement Percentage: (29.333 / 30) x 100 = 97.78%
Operator C Repeatability
- Part Scores for Agreement: 30 parts x 1.0 = 30.0
- Part Scores for Disagreement: 0 parts x 0.333 = 0
- Total Part Score: 30.0
- Agreement Percentage: (30.0 / 30) x 100 = 100%
Overall Repeatability
- Average Agreement Percentage: (95.55% + 97.78% + 100%) / 3 = 97.78%
07. Reproducibility in Attribute Gage R&R
To calculate Reproducibility (Between-Appraiser Agreement), we take each operator's most common answer (we call this the mode) for each part, and then compare if all operators got the same most common answer
Calculating Reproducibility
(Number of matching results between inspectors / Total opportunities) x 100%
Agreement: 30 (Number of parts where modal values for all operators agree)
Agreement Percentage: (30 / 30) x 100 = 100%
08. Effectiveness in Attribute Gage R&R
Effectiveness (Agreement with Reference Value) measures how well operators match the reference or master value for each part. We take each operator's most common answer (mode) for each part and compare that mode to the reference value in column 2.
Then we calculate the percentage of matches for each operator.
(Number of correct assessments / Total number of assessments) x 100%
Individual Operator Effectiveness
Operator A: (30 matching / 30 total) x 100 = 100%
Operator B: (30 matching / 30 total) x 100 = 100%
Operator C: (30 matching / 30 total) x 100 = 100%
Overall Operator Effectiveness
Sum: 100% + 100% + 100% = 300%
Average: 300% / 3 = 100%
09. Evaluating Results: Attribute Gage R&R
An attribute Gage R&R study analyzes three key metrics: repeatability (consistency of individual operators), reproducibility (agreement between different operators), and effectiveness (agreement with known reference values).
Results are typically considered acceptable when all three metrics exceed 90% agreement. This structured evaluation helps organizations determine if their attribute measurement system is capable and reliable for its intended use.
| Metric | Result | Threshold | Status |
|---|---|---|---|
| Repeatability | 97.78% | ≥ 90% | ✓ Acceptable |
| Reproducibility | 100% | ≥ 90% | ✓ Acceptable |
| Effectiveness | 100% | ≥ 90% | ✓ Acceptable |
10. Variable Gage R&R Study
If the measurement system outputs variable data - or numerical measurements (example: 0.0021, 0.0023, 0.0019 ...) - then we use a Variable Gage R&R study.
Common measurement systems with variable data output include Micrometers, Calipers, CMMs, Height gages, Dial indicators, Temperature probes etc.
A Variable Gage R&R study typically requires 10 parts that represent the production range, 3 operators who normally perform the measurements, and 2-3 trials per operator per part, resulting in 60-90 total measurements.
The study analyzes the variation from two sources: repeatability (equipment variation - the same operator measuring the same part multiple times) and reproducibility (operator variation - different operators measuring the same part).
Results are typically expressed as a percentage of either the process variation (%TV) or the tolerance range (%Tolerance), with acceptance criteria of less than 10% for critical characteristics. This analysis helps organizations determine if their measurement system can adequately distinguish between parts and reliably monitor their process.
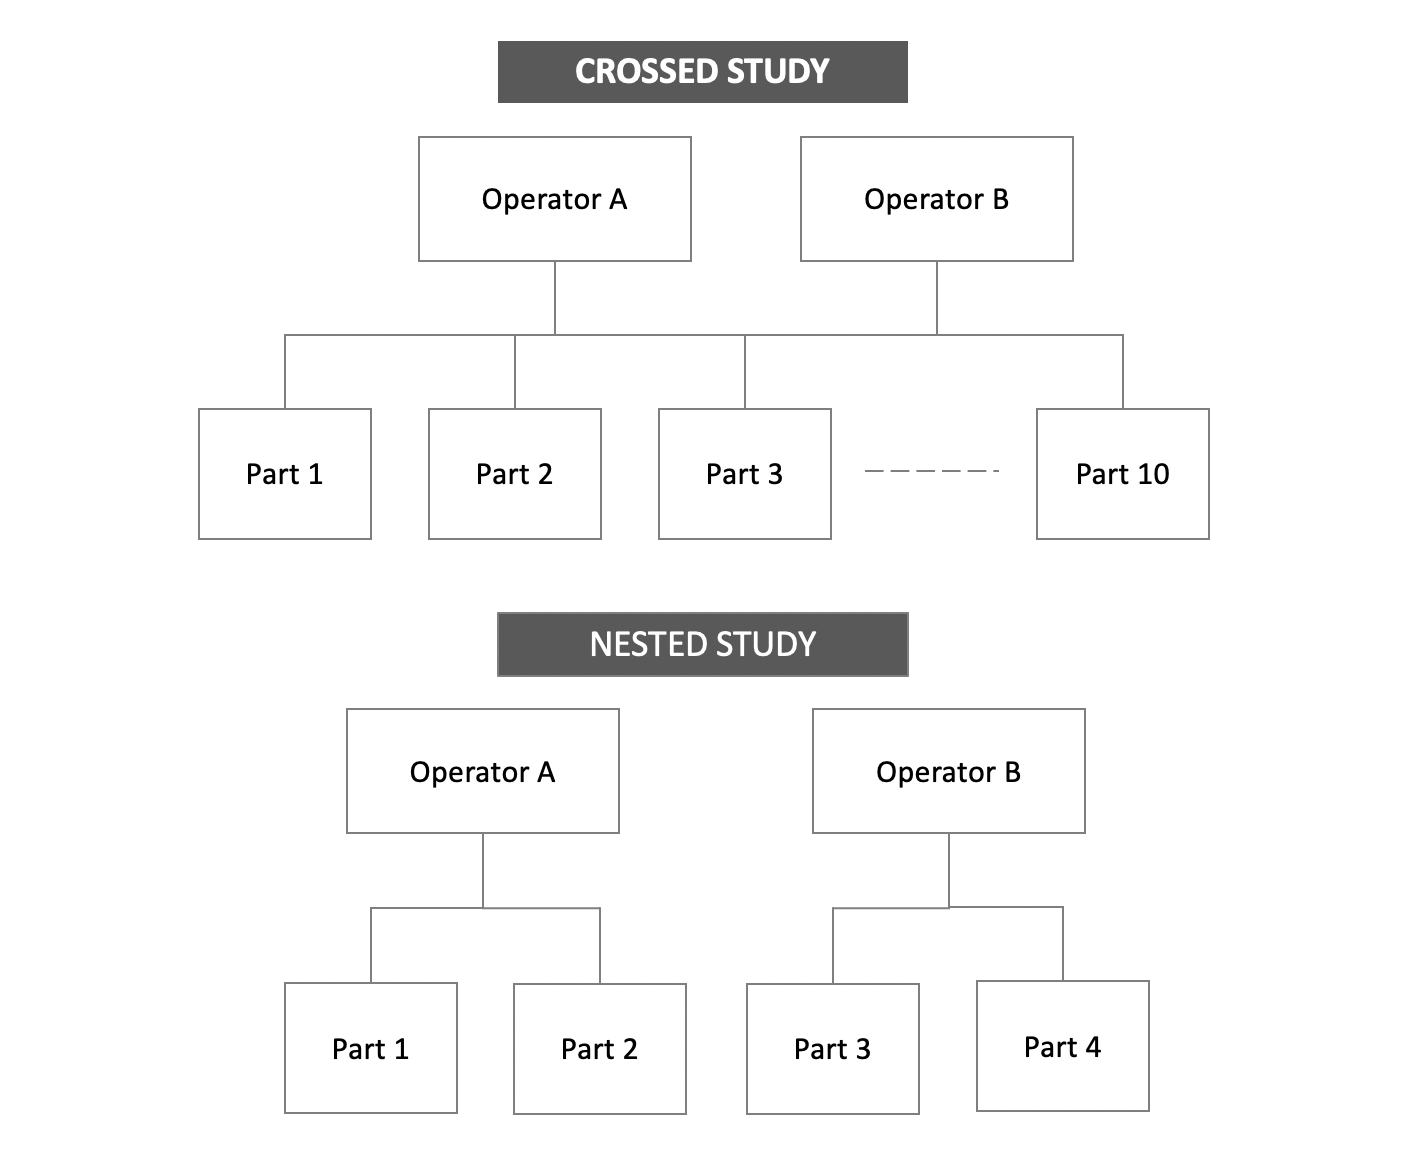
Variable Gage R&R studies are sub-classified into:
- Crossed Gage R&R: In the most commonly used method, the study is crossed i.e., each operator measures each part or sample multiple times. We'll explore this method for the rest of this guide.
- Nested Gage R&R: In some cases, it is not possible for each operator to measure each part or sample multiple times (e.g. destructive tests), requiring a nested study in which each operator measures a different set of parts (i.e. the parts are "nested" under the operator).
12. ANOVA (Analysis of Variance) Overview
When you meaure parts, you'll see some differences in sizes (we call this variation). We use a technique called ANOVA (Analysis of Variance) to help us understand where the variation comes from.
ANOVA uses a very simple trick to calculate the fraction of variability from Parts, Operators, and Equipment. It groups the data set in three different ways to examine whether the measurement differences are between parts (desired), or between operators (a reproducibility problem), or between trials (a repeatability problem). The groupings are:
- All the Data (Total Variation)
- Grouping by Parts (Part Variation)
- Grouping by Operator (Reproducibility)
- Grouping by Equipment (Repeatability)
11. ANOVA (Analysis of Variance) Math
ANOVA for Gage R&R uses a systematic approach to break down the total variability in a set of measurements into its components: variation due to the parts, operators, and equipment.
The goal is to assess whether the majority of variation in the measurements is due to the parts (which is desired), or if it is due to operator differences (reproducibility issues), or to the measurement system itself (repeatability issues).
Here are the general steps:
- Calculate the Differences from the Group Average: Each measurement's difference from the group average is computed.
- Square the Differences and Sum Them: The squared differences are summed to give the Sum of Squares (SS), which represents the total variation.
- Convert Sum of Squares to Variance (Mean Squares): The sum of squares is divided by their respective degrees of freedom to obtain Mean Squares (MS).
There are four key components of variation:
- Total Variation: This includes all sources of variation (parts, operators, and equipment), and serves as a baseline for the analysis.
- Part Variation: Ideally, most of the variability should come from the parts themselves, as parts are the true source of difference.
- Operator Variation (Reproducibility): This measures the differences caused by different operators.
- Equipment Variation (Repeatability): This measures the differences in measurements taken by the same operator on the same part, which is due to the equipment or measurement device.
Important Concept: Degrees of Freedom (df)
Degrees of freedom represent the number of independent values that are free to vary when estimating a parameter.
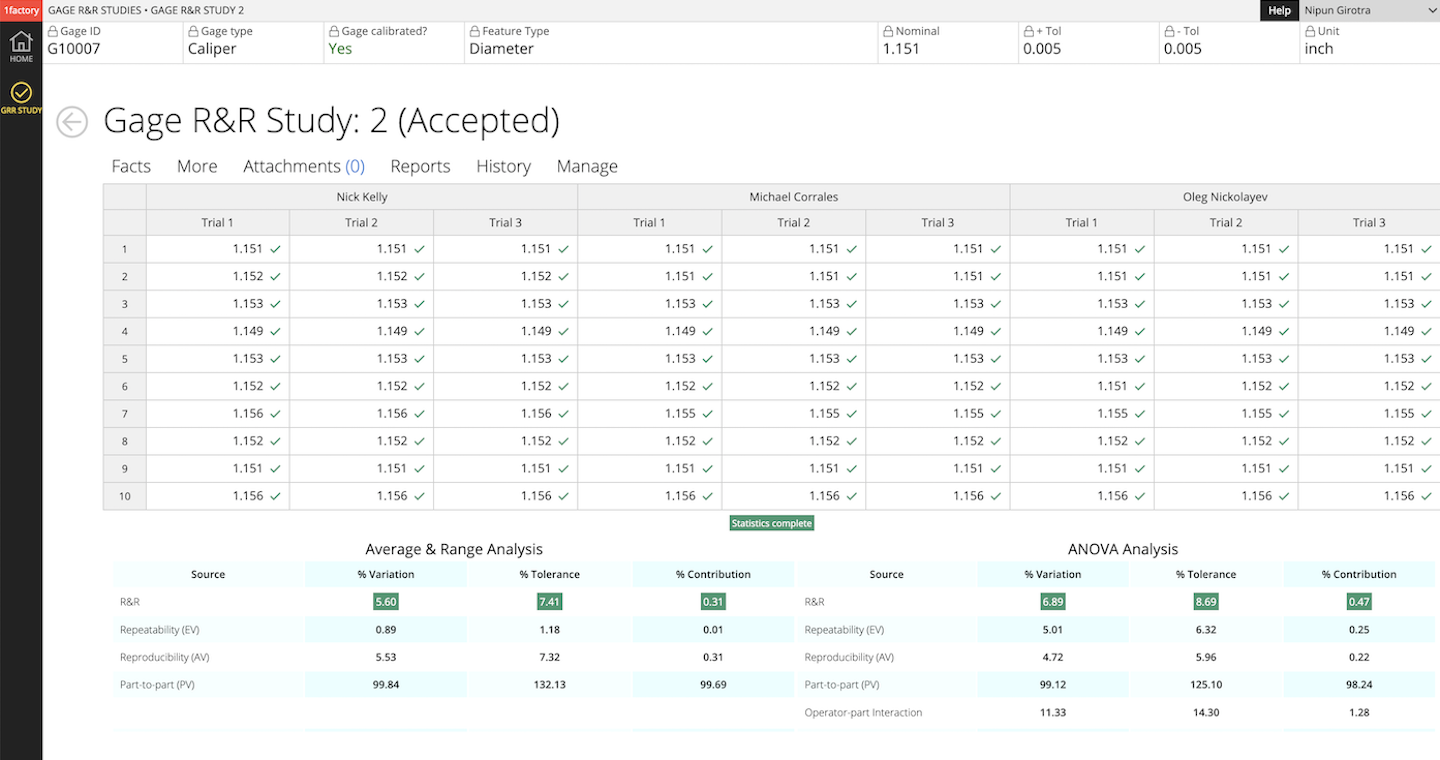
12. Setting up the Variable Gage R&R Study
We begin by organizing the study. The study should have the following dimensions:
- Measurements (n): 90
- Parts (p): 10
- Operators (o): 3 (Operator A, B, and C)
- Trials per operator (r): 3 (Each operator measures each part three times)
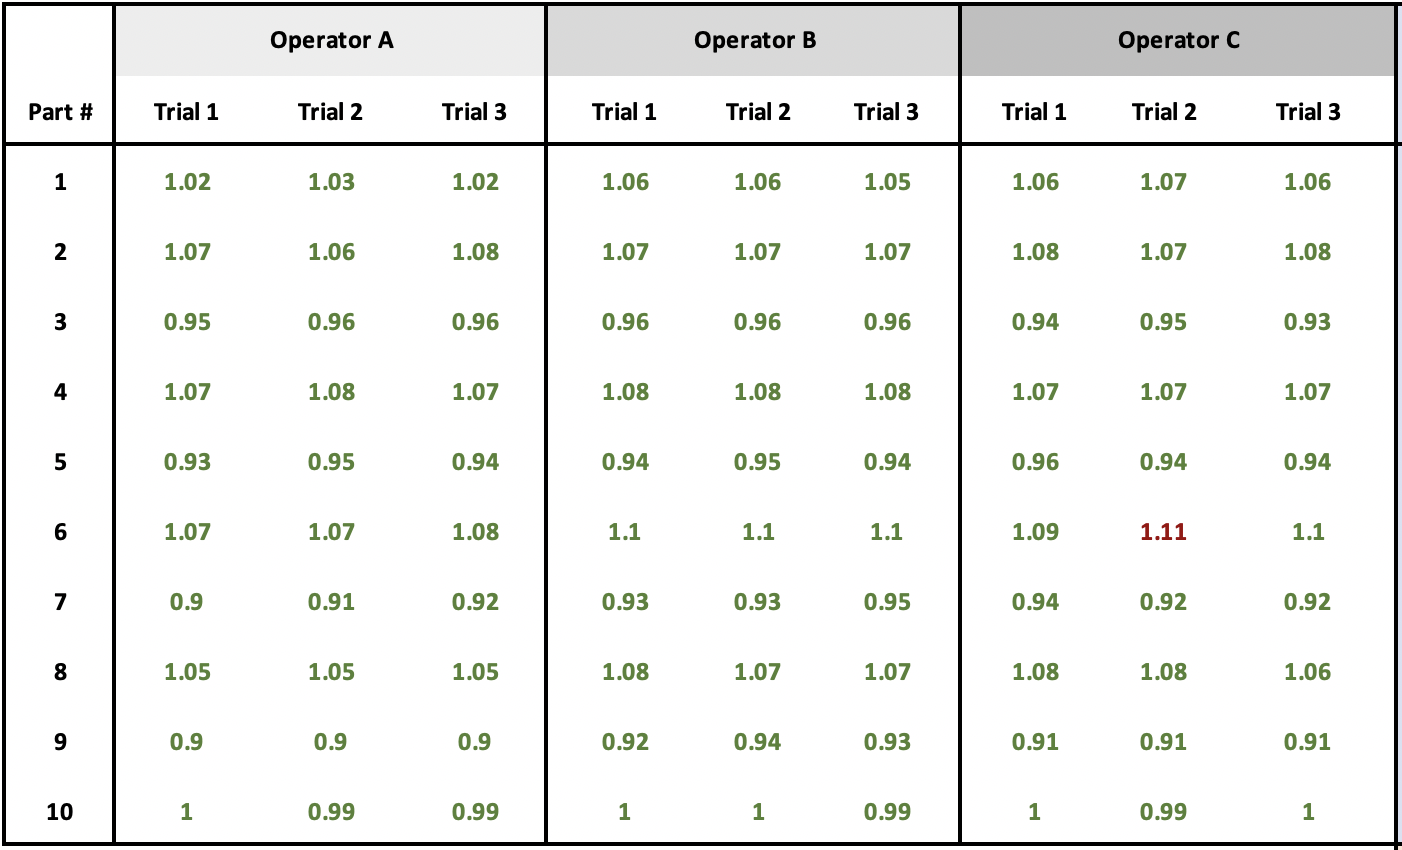
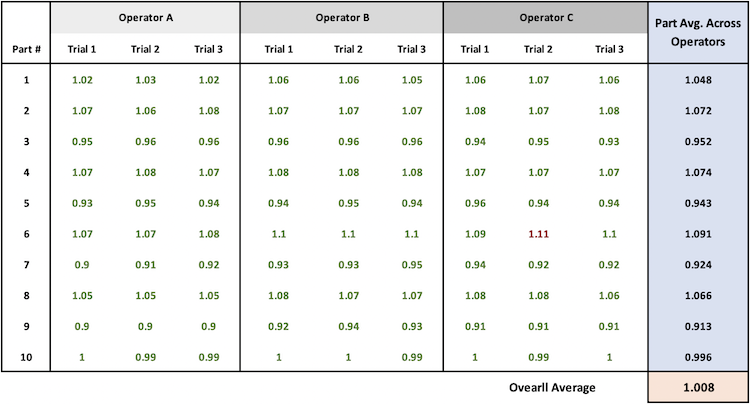
Then we collect the data in a table like the one on the right.
Note: Parts are presented to the operators in random order to prevent bias during measurement.
13. Total Variation
The next step is to calculate the total variation. Total variation provides the baseline for our analysis. It includes all sources of variation (parts, operators, and measurement error). We'll break this total variation into its components in the following sections.
To calculate the total variation, we calculate the sum of the square of the difference between each measured value and the overall average. We call this the Total Sum of Squares (SS-Total).
Calculate the Sum of Squares Total
First, we need to calculate the overall average of all measurements.
Next we subtract the overall average from each measurement, then square this difference. We repeat this for meach measurement, and finally add up all the squared differences.
SSTotal = Sum of (Each measurement - Overall average)2
Total Variance
df = n-1
MSTotal = SSTotal/df
Raw Data
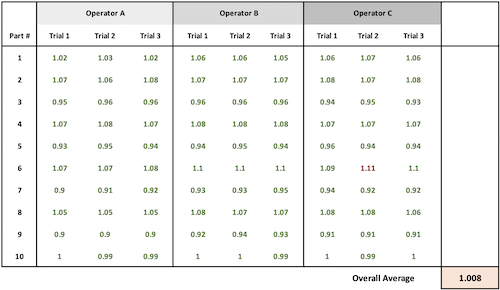
Overall Average
Overall Average = 90.72 / 90 = 1.008
Squared Differences
- Measurement 1: (1.02 - 1.008)2 = (0.012)2 = 0.000144
- Measurement 2: (1.03 - 1.008)2 = (0.022)2 = 0.000484
- Measurement 3: (1.02 - 1.008)2 = (0.012)2 = 0.000144
- [continue for all 90 measurements]
Mean Squares Total
SSTotal = 0.000144 + 0.000484 + 0.000144 ... [for all 90 measurements]
df = n-1 = 89
MSTotal = SSTotal/df = 0.397239/89 = 0.004463
14. Part Variation
Ideally, all variation comes from the parts themselves. So we expect to see a high amount of variation between parts.
To determine how much variation comes from the parts, we group the data by part, and calculate the average for each Part. Then we compare each of these Part Averages to the Overall Average.
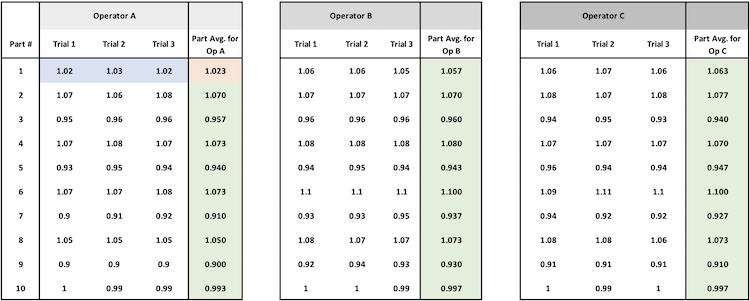
Calculate Sum of Squared Differences for Parts
First we calculate the average for each part. In our sample data set, this is the avearge measurement for each row shown in blue.
Next, we calculate the Difference between each Part Average and the Overall Average, and square the difference.
This is the sum of the square of the difference between each part average and the overall average. There are 10 parts, and we calculate 10 Square-Error terms that we sum to arrive at SS-Parts.
SSPart = r x o x (Sum of Squared Differences)
Part Varaince Component
MSPart = SSPart / df
df = p-1
Data Grouped by Part
Average for Each Part
- Part 1 Average: (1.02 + 1.03 + ... + 1.07 + 1.06) / 9 = 1.048
- Part 2 Average: (1.07 + 1.06 + ... + 1.07 + 1.08) / 9 = 1.072
- [...continue for all parts...]
Squared Differences
- Part 1 Squared Difference: (1.048 - 1.008)² = 0.0016
- Part 2 Squared Difference: (1.072 - 1.008)² = 0.0041
- [...continue for all parts...]
Part Variance
SSPart = 0.394011
df = p -1 = 10 - 1 = 9
MSPart = SS/df = 0.394011/9 = 0.043779
15. Reproducibility (Operator Variation)
Calculate Average for Each Operator
To determine how much variation comes from the operators, we group the data by Operator and calculate the average for each Operator. Then we compare each of these Operator averages to the overall average.
Calculate Sum of Squared Differences for Operators
Take each operator's average, subtract the overall average, and square it.
Multiply the squared differences by total measurements per operator (trials × parts). This shows how much variation comes from different operators measuring the same parts.
SSOperator = r x p x Sum(operator average - overall average)2
Operator Variance Component
MSOperator = SSOperator / df
Where df = degrees of freedom
df = o-1
Data Grouped by Operator
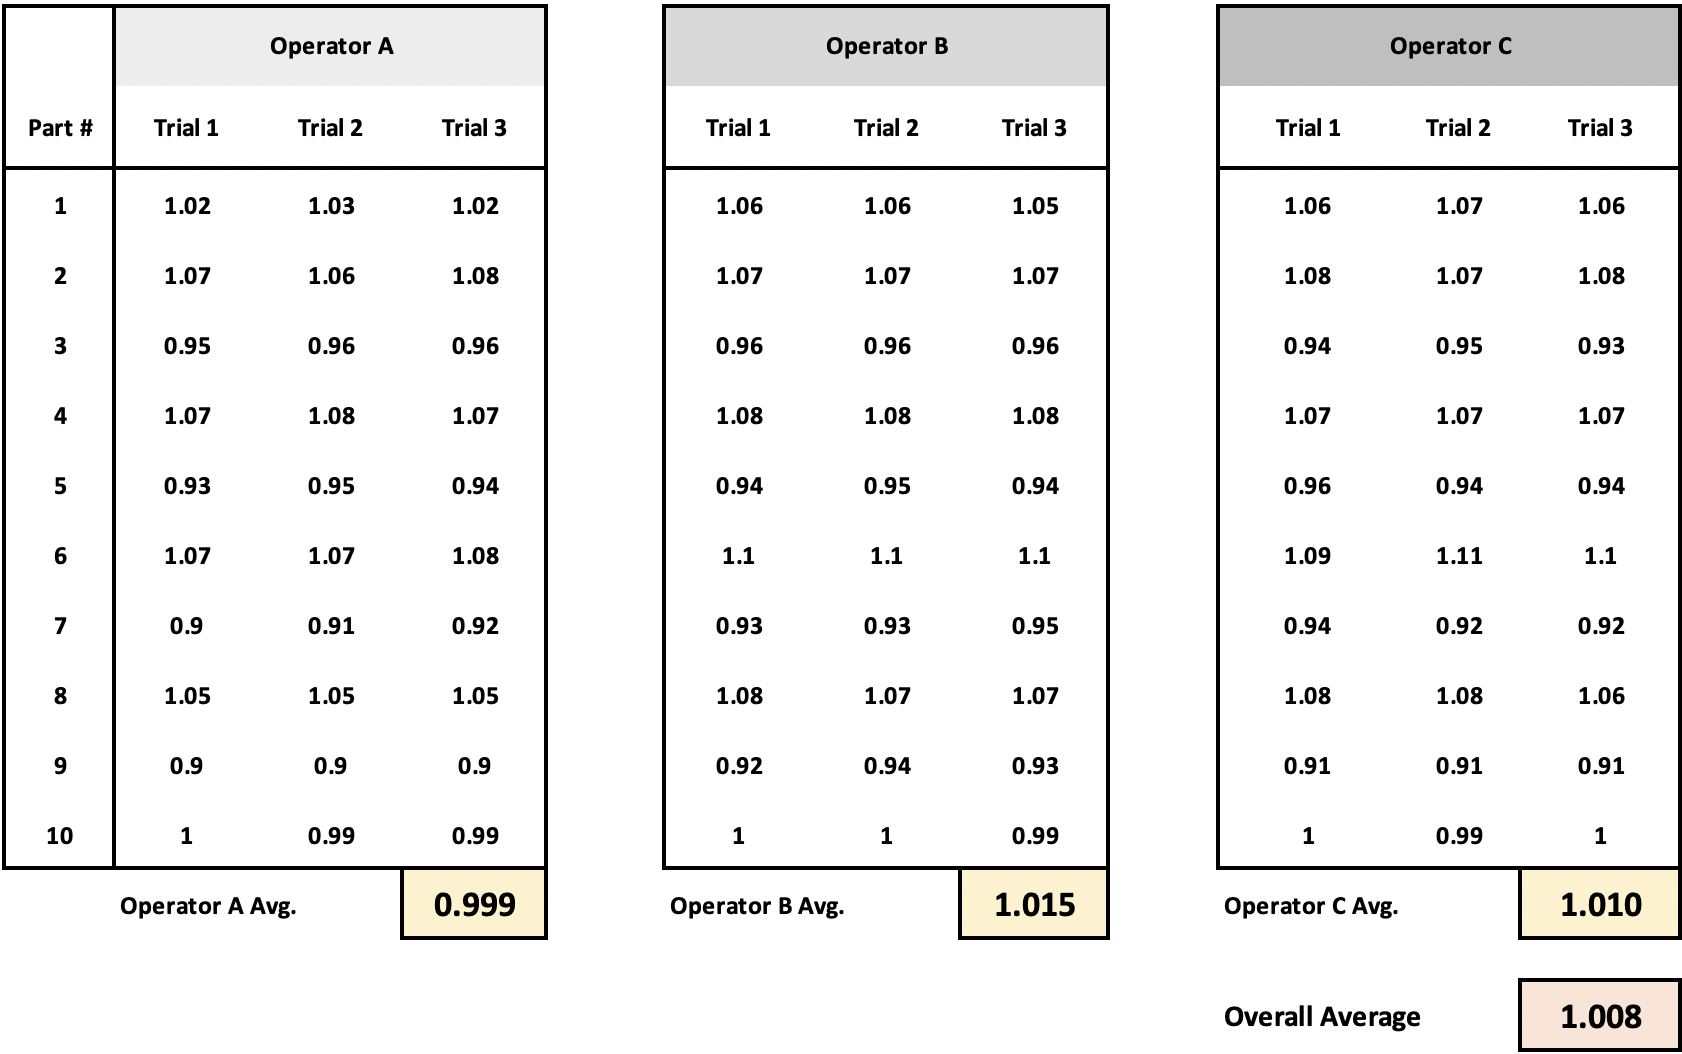
SSOperator = r x p x sum(operator average - overall average)2
- Operator A: (0.999 - 1.008)2 x 30 = (-0.009)2 x 30 = 0.002430
- Operator B: (1.015 - 1.008)2 x 30 = (0.007)2 x 30 = 0.001470
- Operator C: (1.010 - 1.008)2 x 30 = (0.002)2 x 30 = 0.000120
Operator Variance
SSOperator = 0.004020
df = o-1 = 2
MSOperator = SS/df = 0.004020/2 = 0.002010
16. Repeatability (Gage variation)
Quantifying the equipment measurement requires a different comparison.
This time, to determine how much variation comes from the equipment, we group data by Operator and Part and calculate the average for each Operator and Part combination.
Then we compare each measurement to its group average (i.e. to its Operator-Part Average). This grouping gives us just the equipment variation because it is the same operator measuring the same part three times.
Take each measurement, subtract its operator-part combination average, square the difference, then sum all these squares. This shows how much variation occurs when the same operator measures the same part repeatedly.
This is the sum of the square of the difference between each operator-part measurement and the corresponding operator-part average. There are 30 operator-part combinations and 90 measurements. We calculate 90 Square-Error terms that we sum to arrive at SS-Equipment
SSGage = Sum(measurement - operator-part average)2
Equipment Variance Component
MSEquipment = SSEquipment / df
Data Grouped by Equipment
Square Error
Operator A, Part 1:
- Measurements: 1.02, 1.03, 1.02
- Average = 1.0233
- Differences: -0.0033, 0.0067, -0.0033
- Squared Differences: 0.000011, 0.000045, 0.000011
- Sum of Squared Differences = 0.000067
[...continue for all operator-part combinations...]
Equipment (Gage) Mean Squares
Final SSGage = 0.002710
df = p x o x (r-1) = 10 x 3 x (3-1) = 60
MSEquipment = SS/df = 0.002710/60 = 0.000045
17. Interaction between Operator and Gage i.e. Error Term
The interaction sum of squares is calculated by subtracting out the SSParts, SSOperator, and the SSEquipment from the SSTotal
SSInteraction = r x ( SSTotal - SSParts - SSOperator - SSEquipment)
Interaction Variance Component
MSInteraction = SSInteraction / df
df = (p-1)(o-1)
Variance = SSInteraction
This represents unexpected variations that occur when specific operators measure specific parts
Interaction between Operator A and Part 1
- Operator-Part Average = 1.0233
- Operator Effect = 0.999 - 1.008 = -0.009
- Part Effect = 1.0478 - 1.008 = 0.0398
- Interaction = 1.0233 - 0.999 - 1.0478 + 1.008 = -0.0155
- SSInteraction = (-0.0155)2 x 3 = 0.000721
[...continue for all operator-part combinations...]
Interaction Effect
SSInteraction = 0.001180
df = (p-1)(o-1) = 9 x 2 = 18
Variance = SS/df = 0.001180/18 = 0.000066
18. Calculating Total Variance and Percentages
Total Variance
Total Variance = Part Variance + Operator Variance + Equipment Variance + Interaction Variance
Percentage Calculations
Part % = (Part Variance / Total Variance) x 100
Operator % = (Operator Variance / Total Variance) x 100
Equipment % = (Equipment Variance / Total Variance) x 100
Interaction % = (Interaction Variance / Total Variance) x 100
Gage R&R % = ((Operator Variance + Equipment Variance + Interaction Variance) / Total Variance) x 100
| Source of Variation | Sum of Squares | Degrees of Freedom | Mean Square | Variance Component | % of Total Variance |
|---|---|---|---|---|---|
| Parts | 0.394011 | 9 | 0.043779 | 0.043779 | 95.37% |
| Operators | 0.004020 | 2 | 0.002010 | 0.002010 | 4.38% |
| Equipment | 0.002710 | 60 | 0.000045 | 0.000045 | 0.10% |
| Interaction | 0.001180 | 18 | 0.000066 | 0.000066 | 0.15% |
| Total Variation | 0.397239 | 89 | 0.045900 | 0.045900 | 100% |
19. Commonly used Acceptance Criteria
To evaluate a Gage R&R report, you must review the Total Gage R&R Percentage
- Less than 10%: Excellent measurement system (Can reliably detect small part differences. Appropriate for tight tolerance measurements)
- 10-30%: Conditionally acceptable (May be acceptable depending on: Application criticality, Measurement cost, Process capability)
- Over 30%: Needs improvement
20. Number of Distinct Categories (NDC)
The Number of Distinct Categories (ndc) tells us how many different groups of parts our measurement system can reliably distinguish. It's a practical way to understand if our measurement system is good enough for our needs.
Calculating NDC
NDC = SQRT(2 x (Part Variation / Measurement Variation))
Evaluating NDC
An example: Imagine sorting marbles by size. If ndc = 2, your measurement system can only reliably tell if marbles are "small" or "large". But if ndc = 5, you can reliably sort marbles into 5 size groups. I.e. you can detect smaller differences between parts.
ndc = 2: You can only sort parts into "good" or "bad"
ndc = 5: You can track parts trending toward specification limits
ndc = 10: You can detect subtle process shifts
21. Automating Gage R&R Calculations
1factory's Gage Calibration and Gage R&R software automates and speeds-up Gage R&R / MSA calculations (total variation, reproducibility, repeatability, NDC). Learn More