Is Your Inspection Data Hiding a Secret?
My friend, Jon, was asked to review a chart similar to the one shown here during an interview for a position in supplier quality management.
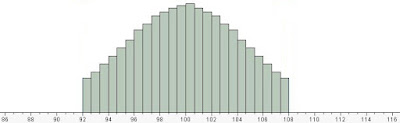
Incoming Inspection Data for Large Number of Parts
The histogram showed the incoming inspection data for a large number of parts from a supplier. The curve was supposed to show that each part was built to spec, and show that the supplier had no quality issues. Jon informed the interviewer that the curve was only showing half of the picture, and that he suspected there was more to the story.
Jon then asked the interviewer what the upper and lower spec limits were. When the specs were added to the chart, it became obvious that the data was truncated. John explained to the interviewer, that in his opinion the supplier was testing each part, and only shipping those that met specifications. Later, the interviewer followed up with the supplier, and found that Jon’s assessment was correct.
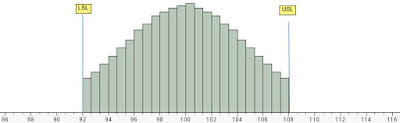
Incoming Inspection data with USL, LSL
This is a surprisingly common occurrence. If you are using an attribute sampling plan (Z1.4 or c=0) for receiving inspection, your data may also be hiding similar secrets. A quick way to check for the Truncation Effect is to use Process Performance Analysis (Pp, Ppk). The standard formula for Process Capability is Pp = (USL - LSL)/(6* sigma). The Pp for the truncated data = (108-92)/(6*3.88) = 0.68 which is less than 1.
A value of Pp < 1, tells us that the spec width is smaller than the process width, and that the supplier must be producing nonconforming parts.
The impact of the truncation effect
The curve in the above picture was generated using a random set of data with a mean of 100 and standard deviation of 5. In this theoretical example, I have set the lower spec limit at 92 and upper spec limit at 108. This is the same as removing approximately the lower 5.4% and upper 5.4% of the curve. In other words, the supplier would have to produce 111 parts in order to ship 100 parts. This increases lead time and cost for both the supplier and the buyer.
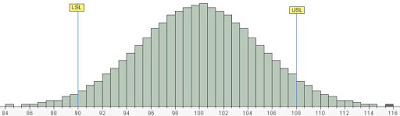
Histogram including truncated parts and fitted normal distribution
The histogram below is another view of the same set of data adding back the parts that the supplier had removed.This chart clearly shows the long flat tails that are typical of a normal distribution. Using a statistical software application (JMP), I have added the theoretical normal distribution curve. In this case, the mean is 100 and the calculated standard deviation is 4.97. Notice how the curve closely matches the data set in this example.
Next, I calculated the distribution for the incoming inspection excluding the truncated data points. The stats software calculated the same mean of 100 but a lower standard deviation of 3.88. Below is the calculated normal distribution curve overlaid on the incoming inspection data.
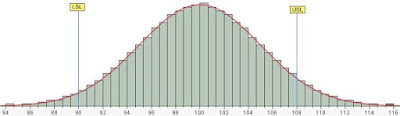
Calculated Normal Distribution overlaid on data with the Truncation Effect
Notice that the center of the calculated curve is higher than the center points and that the edges of the curve are lower than the data points. The truncation effect could therefore mislead you by showing a significantly lower standard deviation.
Why is it important to look for the Truncation Effect?
If all of your parts pass incoming inspection, you may believe that your supplier is producing high quality parts. However when you use a Process Performance Analysis on the data, or simply view the histogram, you may find that your data is truncated. A truncated data-set is an opportunity to reduce lead times and costs for both buyer and supplier.
If your data is indeed truncated, you should follow up with your supplier to determine what is causing the truncation. There may be natural limits to the process that causes the data to appear truncated, or there may be a significant opportunity to improve the supplier’s manufacturing process.
By working with your supplier you can understand why the data appears truncated, and implement any corrective actions that are necessary.